Real case verification: the Braunsbach event
The “Braunsbach event” – the hazardous event which took place in Braunsbach town on 29 May 2016 and was triggered by torrential rainfall.
This event is in strong focus of the Hydrology and Climatology Group led by Axel Bronstert in the University of Potsdam and we tested all of our models on this data span for first. Read more in the paper.
Libraries we use
rainymotion – models, metrics, pre/postprocessing
numpy – general manipulations with arrays
h5py – reading sample data from HDF5 format
matplotlib – plotting
[1]:
# import rainymotion library
from rainymotion import models, metrics, utils

# import accompanying libraries
from collections import OrderedDict
import numpy as np
import h5py
import matplotlib.pyplot as plt

%matplotlib inline
[2]:
# import sample data
data = h5py.File("../../data/data.h5", mode="r")
# import dictionary with timestep indexes
# dictionary structure: {"t": [ [t-24, t-23,..., t-1], [t+1,...,t+12] ]}
eval_idx = np.load("../../data/eval_dict.npy").item()
[3]:
# create placeholder (or load previously calculated) results
results = h5py.File("../../data/results.h5")
[4]:
# create ground truth predictions
def ground_truth(data_instance, eval_instance, results_instance):

    results_instance.create_group("/GT/")

    for key in sorted(list(eval_instance.keys())):

        ground_truth = np.array([ data_instance[key][()] for key in eval_instance[key][1] ])

        results_instance["/GT/"].create_dataset(key,
                                                data=ground_truth,
                                                dtype="float16",
                                                chunks=(12,100,100),
                                                maxshape=(12,900,900), compression="gzip")
If you want to run calculations by yourself, please, uncomment corresponding cells.
%%time
ground_truth(data, eval_idx, results)

"""
Intel Core i7
CPU times: user 34.2 s, sys: 496 ms, total: 34.7 s
Wall time: 35.1 s
"""
[5]:
def persistence(data_instance, eval_instance, results_instance):

    results_instance.create_group("/Persistence/")

    for key in sorted(list(eval_instance.keys())):

        inputs = np.array([ data_instance[key][()] for key in eval_instance[key][0][-1:] ])

        model = models.Persistence()

        model.input_data = inputs

        nowcast = model.run()

        results_instance["/Persistence/"].create_dataset(key,
                                                         data=nowcast,
                                                         dtype="float16",
                                                         chunks=(12,100,100),
                                                         maxshape=(12,900,900),
                                                         compression="gzip")
%%time
persistence(data, eval_idx, results)

"""
Intel Core i7
CPU times: user 24.8 s, sys: 104 ms, total: 24.9 s
Wall time: 24.9 s
"""
[6]:
def optical_flow(data_instance, eval_instance, results_instance, model_name):

    if model_name == "Sparse":
        model = models.Sparse()

    elif model_name == "SparseSD":
        model = models.SparseSD()

    elif model_name == "Dense":
        model = models.Dense()

    elif model_name == "DenseRotation":
        model = models.DenseRotation()

    results_instance.create_group("/{}/".format(model_name))

    for key in sorted(list(eval_instance.keys())):

        inputs = np.array([ data_instance[key][()] for key in eval_instance[key][0] ])

        model.input_data = inputs

        nowcast = model.run()

        results_instance["/{}/".format(model_name)].create_dataset(key,
                                                                   data=nowcast,
                                                                   dtype="float16",
                                                                   chunks=(12,100,100),
                                                                   maxshape=(12,900,900),
                                                                   compression="gzip")
%%time
optical_flow(data, eval_idx, results, "Sparse")

"""
Intel Core i7
CPU times: user 8min 34s, sys: 5min 55s, total: 14min 29s
Wall time: 5min 42s
"""
%%time
optical_flow(data, eval_idx, results, "SparseSD")

"""
Intel Core i7
CPU times: user 6min 45s, sys: 5min 53s, total: 12min 39s
Wall time: 5min 13s
"""
%%time
optical_flow(data, eval_idx, results, "Dense")

"""
Intel Core i7
CPU times: user 50min 39s, sys: 1min 16s, total: 51min 55s
Wall time: 15min 51s
"""
%%time
optical_flow(data, eval_idx, results, "DenseRotation")

"""
Intel Core i7
CPU times: user 57min 46s, sys: 1min 16s, total: 59min 3s
Wall time: 22min 56s
"""
[7]:
# load a mask which maps RY product coverage
mask = np.load("../../data/RY_mask.npy")
mask = np.array([mask for i in range(12)])

# Verification block
def calculate_CSI(obs, sim, thresholds=[0.125, 0.250, 0.500, 1.000]):

    result = {}

    for threshold in thresholds:
        result[str(threshold)] = [metrics.CSI(obs[i], sim[i], threshold=threshold) for i in range(obs.shape[0])]

    return result

def calculate_MAE(obs, sim):

    return [metrics.MAE(obs[i], sim[i]) for i in range(obs.shape[0])]

def calculate_metrics_dict(eval_instance, results_instance,
                           model_names=["Persistence", "Sparse", "SparseSD", "Dense", "DenseRotation"]):

    metrics_dict = OrderedDict()

    for model_name in model_names:

        metrics_dict[model_name] = OrderedDict()

        for key in sorted(list(eval_instance.keys())):

            metrics_dict[model_name][key] = {model_name: {"CSI": None, "MAE": None}}

            # observed ground-truth
            o = results_instance["GT"][key][()]

            # results of nowcasting
            s = results_instance[model_name][key][()]

            # convert values from depth (mm) to intensity (mm/h)
            o = utils.depth2intensity(o)
            s = utils.depth2intensity(s)

            # mask arrays
            o = np.ma.array(o, mask=mask)
            s = np.ma.array(s, mask=mask)

            metrics_dict[model_name][key][model_name]["CSI"] = calculate_CSI(o, s)
            metrics_dict[model_name][key][model_name]["MAE"] = calculate_MAE(o, s)

    return metrics_dict
%%time
metrics_dict = calculate_metrics_dict(eval_idx, results)

"""
Intel Core i7
CPU times: user 11min 51s, sys: 16.1 s, total: 12min 7s
Wall time: 12min 7s
"""
np.save("../../data/results_metrics.npy", metrics_dict)
[8]:
metrics_dict = np.load("../../data/results_metrics.npy").item()
[9]:
# Vizualization block
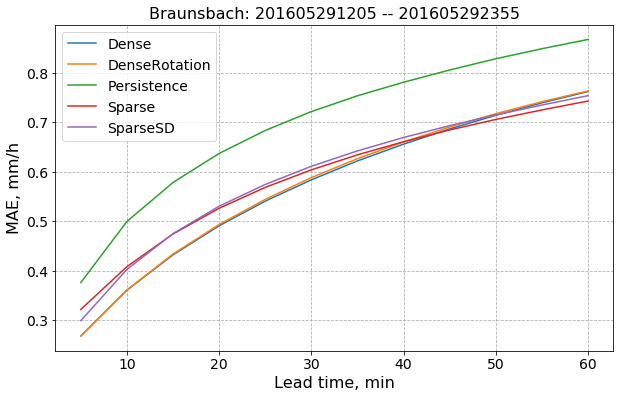
def MAE_simple_plot(metrics_dict, ax, axis=0):
### data preparation block ###
event_name = "Braunsbach"
# create a useful keys
model_names = sorted(list(metrics_dict.keys()))
main_keys = sorted(list(metrics_dict[model_names[0]].keys()))
# create a holder for averaged MAE results
mae = {model_name: None for model_name in model_names}
for model_name in model_names:
mae[model_name] = np.array( [metrics_dict[model_name][step][model_name]["MAE"] for step in main_keys] )
### ### ###
t = range(5, 65, 5)
#fig, ax = plt.subplots(figsize=(12, 8))
for model in model_names:
data = mae[model]
data_to_plot = np.mean(data, axis=axis)
ax.plot(t, data_to_plot, label=model)
ax.grid(linestyle="--")
ax.legend(fontsize=14)
ax.set_title("{}: {} -- {}".format(event_name.title(), main_keys[0], main_keys[-1]), fontsize=16)
ax.set_xlabel("Lead time, min", fontdict={"size": 16})
ax.set_ylabel("MAE, mm/h", fontdict={"size": 16})
ax.tick_params(labelsize=14)
return ax
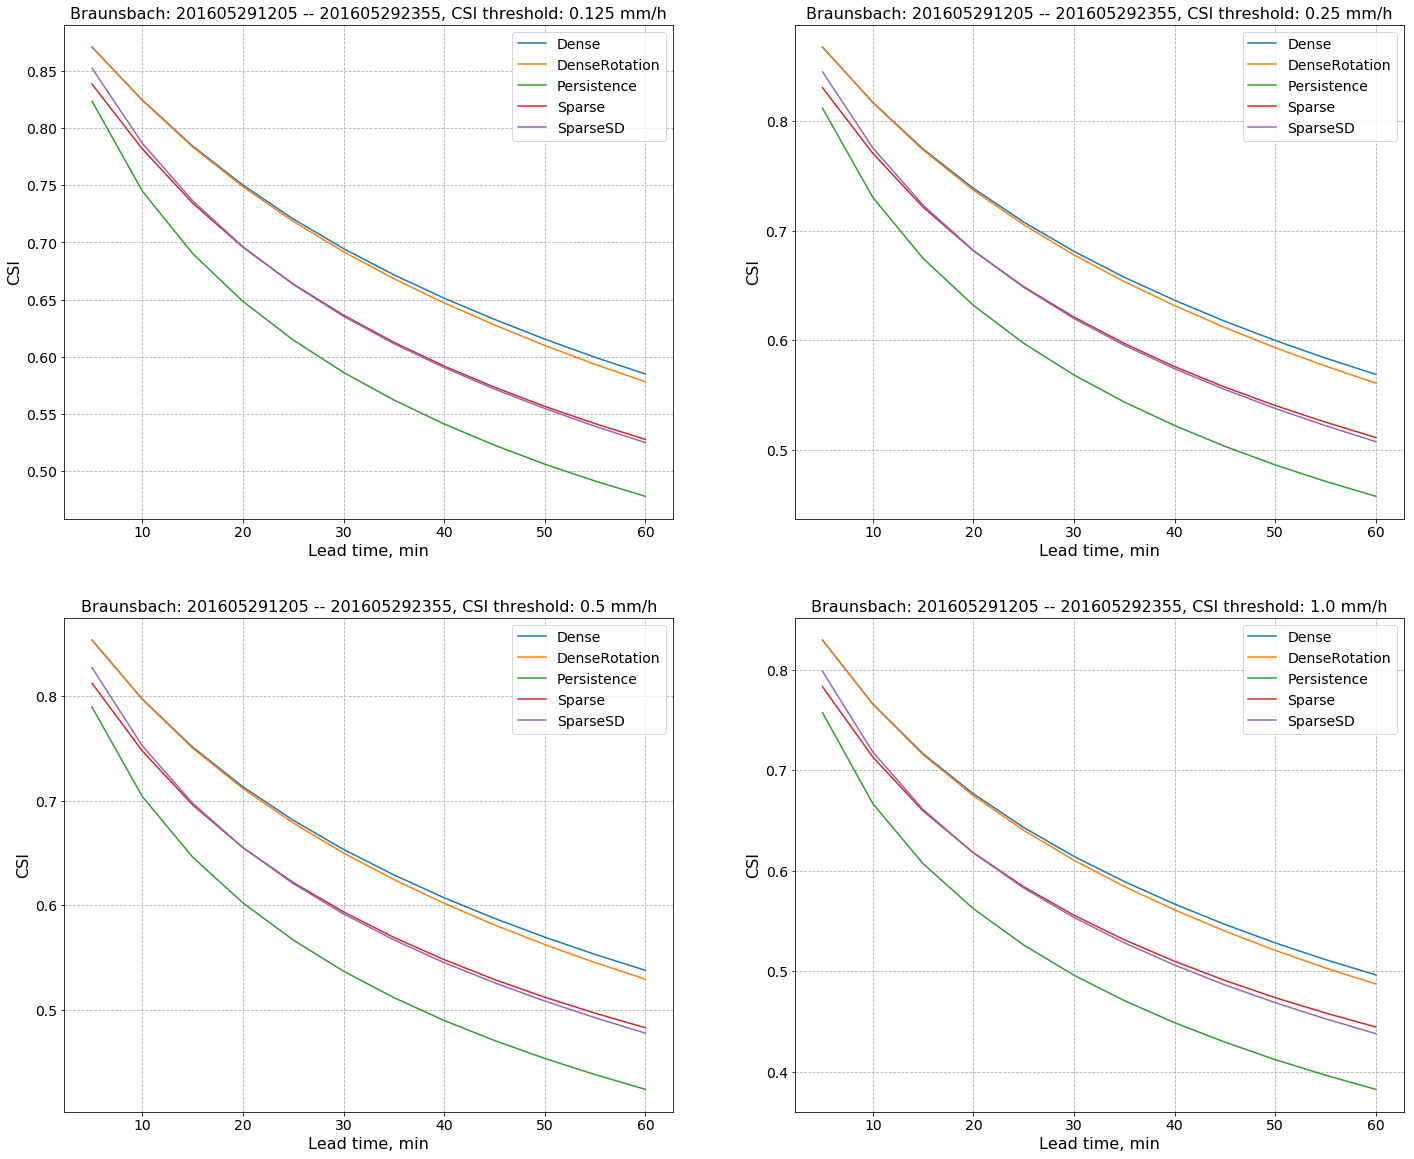
def CSI_simple_plot(metrics_dict, threshold, ax):
"""
threshold should be a string from ['0.125', '0.25', '0.5', '1.0']
"""
event_name = "Braunsbach"
# create a useful keys
model_names = sorted(list(metrics_dict.keys()))
main_keys = sorted(list(metrics_dict[model_names[0]].keys()))
# create a holder for averaged MAE results
csi = {model_name: None for model_name in model_names}
for model_name in model_names:
csi[model_name] = np.array( [metrics_dict[model_name][step][model_name]["CSI"][threshold] for step in main_keys] )
###
t = range(5, 65, 5)
for model in model_names:
data = csi[model]
data_to_plot = np.mean(data, axis=0)
ax.plot(t, data_to_plot, label=model)
ax.grid(linestyle="--")
ax.legend(fontsize=14)
ax.set_title("{}: {} -- {}, CSI threshold: {} mm/h".format(event_name.title(),
main_keys[0],
main_keys[-1],
threshold),
fontsize=16)
ax.set_xlabel("Lead time, min", fontdict={"size": 16})
ax.set_ylabel("CSI", fontdict={"size": 16})
ax.tick_params(labelsize=14)
return ax
[10]:
fig, ax = plt.subplots(figsize=(10,6))
ax = MAE_simple_plot(metrics_dict, ax)
[11]:
fig, axes = plt.subplots(2, 2, figsize=(24,20))
axes = axes.ravel()
for i, threshold in enumerate(['0.125', '0.25', '0.5', '1.0']):
    axes[i] = CSI_simple_plot(metrics_dict, threshold, axes[i])